
White paper
Accelerating quantum device development through faster cryogenic characterization
How fast-feedback cryostats cut delays, reduce costs, and speed up research and development of quantum devices
As quantum device fabrication advances and enables the parallel production of large numbers of devices, it becomes increasingly critical that laboratory infrastructure and measurement technologies keep pace. In most laboratories, dilution refrigerators are the primary cooling solution; however, they require lengthy preparation and cooldown periods that lead to reduced experimental bandwidth and increased operational costs. With the L-Type Rapid kiutra has developed a cryostat, featuring a unique combination of solid-state magnetic refrigeration and automatic sample loading that eliminates these delays and their associated costs.
This analysis will examine the cryogenic measurement process, identify key drawbacks in traditional dilution refrigerators, and calculate the specific cost, time, and sample throughput differences between the L-Type Rapid and traditional dilution refrigerators across multiple scenarios.
The importance of cryogenic characterization for quantum research
Cryogenic characterization sits at the heart of quantum device development, as low-temperature data directly guides design choices and process optimization. As researchers and quantum engineers push toward universal, error-corrected quantum computers, both quantum devices and classical components need to be measured reliably at low temperatures.
Several factors contribute to the ongoing importance of low-temperature characterization, now and in the future:
- Low-temperature environments are required to perform essential measurements of thin-film quality, resonator and qubit performance, and junction characteristics. As for components, cryo-CMOS devices for control and readout, parametric amplifiers, RF wiring, photon detectors, and quantum light sources are commonly investigated.
- Attempts to correlate room temperature characteristics with low-temperature quantum behavior have not yielded robust, generalized models. Given the impact of device aging through, e.g., thermal cycling, mechanical stress, and exposure to gases, such correlations may remain difficult to establish.
- Accurate assessment of quantum properties requires measurements in the low kelvin or millikelvin regime, where key device metrics become accessible with the required sensitivity and precision.
Defining the characterization process
To fully understand where cryogenic characterization can be improved, the different phases in the process need to be established. In our analysis, we use the following definitions:
Sample: A single object characterized at cryogenic temperature, such as a material specimen, a quantum electrical device, or a cryogenic component.
Batch: A group of samples loaded into a cryostat together.
Characterization cycle: The full sequence of actions required to measure one batch of samples. The phases of a characterization cycle are:
- Sample installation: Preparing and loading the sample batch, including electrical checks prior to the loading.
- Cooldown: Cooling the batch to the base temperature to achieve required characterization temperatures.
- Characterization: Conducting the measurement procedures. The duration depends on the sample type, the chosen method, and the batch size for each run.
- Warmup: Bringing the batch back to room temperature.
- Sample uninstallation: Venting and unloading the samples and, when necessary, disassembling parts of the cryostat or airlock.
Pinpointing the cause of the characterization bottleneck
While advances in nanofabrication, including new fabs and pilot lines, enable high throughput and frequent design iterations, cryogenic characterization often remains comparatively slow and labor-intensive. The total time and labor required for sample turnaround clogs the test process, becoming a barrier to a fast-moving design iteration process.
To find the source of this issue, we must examine the equipment used in this characterization process. Today, many laboratories and companies rely on dilution refrigerators, which circulate a liquid mixture of helium-4 and helium-3 isotopes to provide millikelvin temperatures.
Their use is connected to several disadvantages:
- Labor-intensive sample loading: Most dilution refrigerators require the user to remove the radiation shields and vacuum can when loading a new sample batch. Depending on the size and configuration of the refrigerator, this can be a time and labor-intensive process, requiring multiple people and hours of assembly and dismantling the full cryostat.
- Repeated and lengthy cooling/warming process: Once the refrigerator is sealed for the experiment, the complete system must cool down to the desired measurement temperature. This takes typically between 24 to 48 hours, often becoming an obstruction to high-volume testing. After the measurements have been completed, the system must be warmed up again to ambient temperature, leaving it unavailable for measurements for further 12 to 24 hours.
- Higher operational costs: Longer characterization cycles cause additional electricity cost and more space to accommodate the need for additional refrigerators.
Although sample-exchange accessories are available for some dilution refrigerators, many users avoid them because of modest time savings, reduced usable space, and the additional manual work connected to their operation and supervision. As a result, opening and closing the complete cryostat for each batch remains common practice.
Overall, the time and labor-intensive use of dilution refrigerators results in a characterization bottleneck – delaying feedback, extending development cycles, and reducing the overall effectiveness of R&D efforts. It has been identified as a critical obstacle to the development, scaling, and commercialization of quantum computers [1,2,3].
A new approach: the L-Type Rapid
Fast-feedback characterization requires a different system design. Kiutra has developed the L-Type Rapid specifically for this purpose, with mechanisms designed to simplify the sample exchange process and reduce the overall time to characterization.
The L-Type Rapid’s key differentiators include:
- Integrated automated sample loading: An integrated sample loader fully automates the sample loading and cooling processes, minimizing physical interaction with the cryostat to less than 30 minutes. In contrast to the disassembly of the whole cryostat, this simplified loading process reduces manual workload, minimizes downtime between runs, and makes the overall workflow smoother.
- Shortened cooling/warming process: The L-Type Rapid uses solid-state magnetic refrigeration to reach millikelvin temperatures, rather than circulating a liquid helium isotope mixture. As a result, there is no liquid coolant that must be dumped prior to sample exchange and subsequently recondensed to prevent boil-off. The loading and unloading workflow also avoids enforced holds at intermediate temperatures for thermalization, enabling faster, more continuous sample handling.
- Lower overall costs: Through shorter measurement cycles, the L-Type Rapid offers unparalleled labor and time savings. Workflow automation and shorter run times mean less manual work and oversight, while less hours of operation needed to complete the full characterization cycle correspond to cost savings and higher throughput.
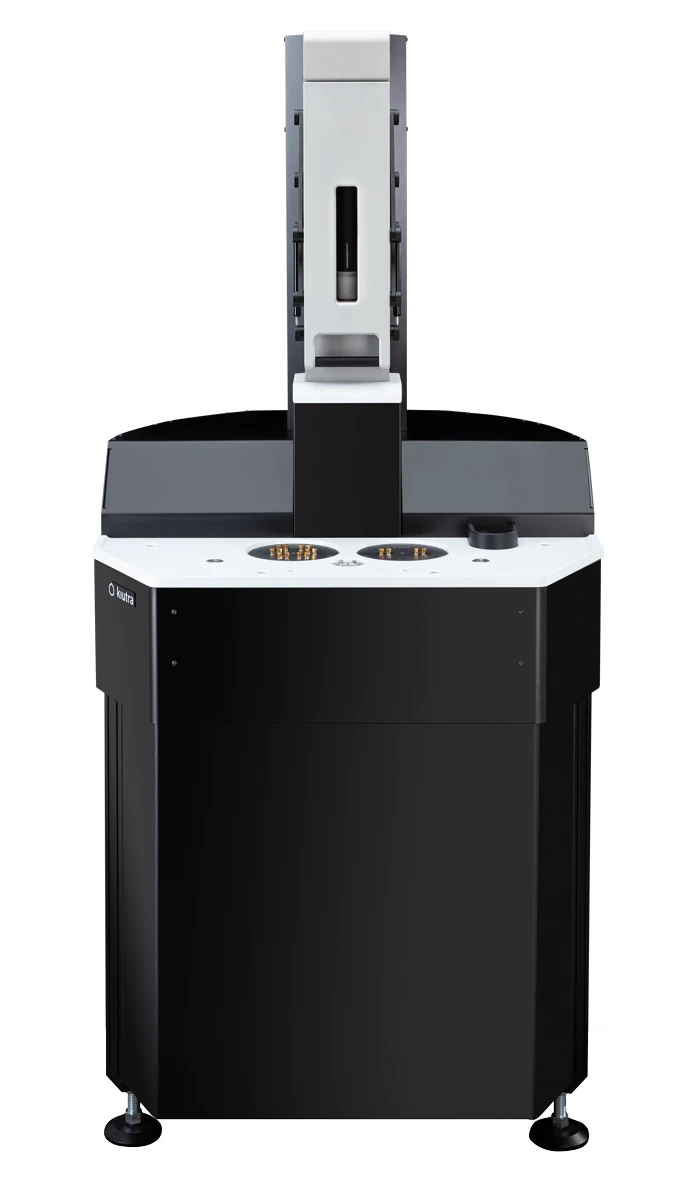
Figure 1: L-Type Rapid cryostat.
How fast-feedback cryostats overcome the characterization bottleneck
The L-Type Rapid comes with bottleneck-eliminating features, but to fully realize the reductions of time and cost that fast-feedback systems can have on quantum device characterization, a model can be used to fully illustrate these differences within the context of a typical lab setup.
To compare the practical performance of both approaches, Table 1 summarizes the typical time effort associated with each phase of a full characterization cycle for the L-Type Rapid and a mid-size dilution refrigerator, each using a single cryocooler for precooling. Additionally included in the model is the inclusion of associated labor and electricity costs as required of each equipment type at that point in the cycle. These figures provide the basis for evaluating feedback speed, throughput, and operating cost in the scenarios that follow.
| kiutra L-Type Rapid (LTR) | Dilution refrigerator (DR) | |||||
|---|---|---|---|---|---|---|
| Phase | Time effort | Time contributes to personnel costs | Time contributes to electricity costs | Time effort | Time contributes to personnel costs | Time contributes to electricity costs |
| Installation | 15 min | Yes | Yes | 2 h | Yes | No |
| Cooldown | 4.5 h | No | Yes | 22 h | No | Yes |
| Sample measurement | Measurement time per sample – depending on sample, method, batch size | No | Yes | Measurement time per sample – depending on sample, method, batch size | No | Yes |
| Warmup | 30 min | No | Yes | 18 h | No | No |
| Uninstallation | 10 min | Yes | Yes | 1.5 h | Yes | No |
| Total | 5.5 h | 43.5 h | ||||
- Time effort
- Time contributes to personnel costs
- Time contributes to electricity costs
Table 1: Comparison – kiutra L-Type Rapid vs. mid-size dilution refrigerator.
To translate time effort into an economic metric, we connect each phase of the characterization cycle to cost by introducing factors for personnel effort and electricity consumption.
- Personnel cost is modeled at €50 per hour, which reflects a typical total annual cost of €100,000 spread across roughly 250 working days.
- Electricity cost is assumed to be €0.25 per kWh. Both systems draw about 8 kW in steady state, corresponding to €2 per operating hour. The L-Type Rapid remains powered continuously, while the dilution refrigerator is powered only during cooldown and measurement. In the interest of simplicity, we neglect that the dilution refrigerator’s input power will be about 1 to 2 kW higher during cooldown.
The number of batches required is:
j = n / b, where n is the number of samples to be studied and b the batch size.
The total time for the full characterization run with either of the cryostats is the sum of the time required for each step multiplied by the number of batches.
T = j × (Tinstallation + Tcooldown + Tcharacterization + Twarmup + Tuninstallation), where Tcharacterization = n × Tsample / j
Personnel cost P can be found by multiplying the number of batches with the cost of personnel and the time they are required, as indicated by Table 1.
P = j × €50/h × (Tinstallation + Tuninstallation)
Electricity cost E for each system can be found by multiplying the number of batches required by the cost per operating hour by the amount of time in the applicable steps that the system draws power.
ELTR = j × €2/h × (Tinstallation + Tcooldown + Tcharacterization + Twarmup + Tuninstallation)
EDR = j × €2/h × (Tcooldown + Tcharacterization)
Below, we examine three representative scenarios that highlight the essential trade-offs between traditional dilution refrigeration and fast-feedback characterization. Together, they offer a realistic view of when each approach works best and where bottlenecks become most severe.
In addition to comparing time and cost for a predefined measurement scenario, it is instructive to assess the impact on annual sample throughput. In practice, a cryostat is not necessarily powered down after completing a characterization cycle but continues operating with subsequent measurements. Consistent with our personnel cost assumption, we therefore assume 250 effective operating days per year. At 24 hours of operation per day, this corresponds to a maximum annual operating time of 6,000 hours. These results for number of samples during one year of continuous operation are presented alongside the cost and time savings.
Scenario 1: Consecutive characterization of individual samples
Scenario 1 considers ten samples characterized individually, one after another, with a moderate measurement time of three hours per sample. This setup reflects a common laboratory workflow, for example in quality control of packaged devices that require sophisticated measurement routines and dedicated setups.
Because installation, cooldown, and warmup times are drastically shorter with the L-Type Rapid, fixed overhead is minimized for every single sample. The calculation indicates a cost and time reduction of more than 80% each compared to the dilution refrigerator. Importantly, the first low-temperature results are available in less than 8 hours, compared to 27 hours with the dilution refrigerator.
In Scenario 1, the L-Type Rapid requires 84 hours to characterize 10 samples, while the dilution refrigerator requires 465 hours for the same number of samples. When scaled to 6,000 operating hours per year, this translates to an annual throughput of approximately 714 samples for the L-Type Rapid compared to about 129 samples for the dilution refrigerator. Under these conditions, the L-Type Rapid enables more than five times higher annual sample throughput. The reduced overhead per batch translates directly into substantially greater usable measurement output over the course of a year.
Sequential single samples
10 samples, 1 per batch, 3 h measurement
- Per sample
- 3 h / sample
- Per batch
- 3 h / batch
10x
Feedback time (h)
Time saving: 72%
Total time (h)
Time saving: 82%
Cost per device (€)
Cost saving: 83%
Total cost (€)
Cost saving: 83%
Figure 2: Consecutive characterization of individual samples.
In a sequential workflow of individually characterized samples, the L-Type Rapid delivers substantial reductions in turnaround time and operating cost. When operated continuously throughout the year, these shorter cycle times translate directly into a substantially higher annual sample throughput. Fast-feedback characterization therefore not only lowers per-batch effort but also fundamentally increases the effective measurement capacity of the laboratory compared to traditional dilution refrigeration.
Scenario 2: Workloads dominated by long measurement durations
Scenario 2 examines conditions where both systems use a batch size of five samples, while the characterization time increases to six hours per sample, doubling the measurement duration compared to Scenario 1. Under these long-measurement conditions, the relative impact of installation, cooldown, and warmup decreases, and the characterization phase accounts for a larger share of the total effort.
While compared to the first scenario the cost saving of the L-Type Rapid narrows to about 67%, it is still substantial. Additionally, the time advantage remains significant, exceeding 50% overall reduction in total characterization time. First results are available after approximately 11 hours with the L-Type Rapid, compared to 30 hours for the dilution refrigerator.
Applying the same assumption of 6,000 effective operating hours per year, the L-Type Rapid allows to achieve an annual throughput of approximately 847 compared to 408 samples with the dilution refrigerator. Thus, even in measurement-time-dominated scenarios, the L-Type Rapid enables more than double the annual output. Although relative cost savings are smaller than in Scenario 1, the gain in achievable development speed and experimental bandwidth remains significant.
Long measurement durations
10 samples, 5 per batch, 6 h measurement
- Per sample
- 6 h / sample
- Per batch
- 30 h / batch
2x
Feedback time (h)
Time saving: 64%
Total time (h)
Time saving: 52%
Cost per device (€)
Cost saving: 67%
Total cost (€)
Cost saving: 67%
Figure 3: Workloads dominated by long measurement durations.
Even when long measurement times dominate the workload, the L-Type Rapid maintains a decisive advantage in time-to-result and overall cycle duration. Although absolute cost differences narrow, the reduced overhead enables significantly higher annual sample throughput. Shorter turnaround times accelerate feedback, increase experimental bandwidth, and support faster design iteration over the course of a full operating year.
Scenario 3: Fast testing of large sample volumes
In Scenario 3, we evaluate a high-throughput setting characterized by many samples and short measurement times of just 30 minutes per sample. This reflects an end-of-line or screening scenario, where fabricated devices are rapidly verified in larger batches. To reflect the larger sample space of dilution refrigerators, we assume a batch size of 10 samples for the dilution refrigerator and 5 samples for the L-Type Rapid.
Even under this assumption, cooldown and warmup overhead continue to dominate the dilution refrigerator’s total time and cost profile. In contrast, the L-Type Rapid minimizes these fixed overheads, resulting in substantially lower operating cost and significantly shorter total cycle time. The calculation shows a cost saving of almost 70% with the L-Type Rapid. The total time effort is reduced to below 80 hours, compared to more than 240 hours for the dilution refrigerator, corresponding to a time saving of almost 70%.
In Scenario 3, characterized by short measurement times and larger batch sizes, reduced overhead has an even stronger impact on annual throughput. The latter amounts to approximately 3,797 samples for the L-Type Rapid and 1,237 samples for the dilution refrigerator. In a high-volume screening or end-of-line environment, the L-Type Rapid therefore enables more than three times higher annual sample throughput. This difference can have a decisive impact on scaling speed, development cycles, and overall operational efficiency.
High-throughput screening
50 samples, 5 per batch, 0.5 h measurement
- Per sample
- 0.5 h / sample
- Per batch
- 2.5 h / batch
10x
Feedback time (h)
Time saving: 79%
Total time (h)
Time saving: 68%
Cost per device (€)
Cost saving: 68%
Total cost (€)
Cost saving: 68%
Figure 4: Fast testing of large sample volumes.
While increasing batch size improves efficiency for both approaches, the L-Type Rapid continues to deliver clear and quantifiable advantages in total cycle time and operating cost. These gains scale directly into substantially higher annual throughput, particularly in high-volume environments with short test durations. As a result, fast-feedback cryogenic characterization enables more effective scaling and higher productive output across the entire year.
Massive parallelization through large batch sizes
A natural follow-up question is whether even larger batch sizes could further reduce overhead by minimizing cryostat preparation, cooldown, and warmup. While large dilution refrigerators can indeed accommodate such batches, parallel characterization of many samples can include additional costs outside of expected projections and often renders the large batch approach not economically feasible. True parallelization requires substantial investment in complex cryogenic wiring, integrated cryogenic electronics, and extensive room-temperature measurement equipment, which quickly becomes cost-prohibitive. Multiplexing offers an alternative by reducing wiring and electronics complexity, but it serializes measurements and therefore increases total characterization time, offsetting much of the benefit gained from cooling larger batches. In both cases, the time to first result increases compared to the scenarios discussed above, delaying early feedback on sample quality and performance.
Additional time savings due to fast feedback
Across all evaluated scenarios, the feedback time at which the first low-temperature characterization results become available to the user remain substantially lower for the L-Type compared to the dilution refrigerator. In practice, this is particularly valuable as these first results allow users to identify issues in the measurement setup, wiring, or sample batch. Therefore, short feedback times help avoid erroneous or unnecessary measurements, saving again time and cryostat capacity – a benefit which cannot be fully reflected by our model.
Calculate your potential time and cost savings
how many devices go through the full characterization cycle
the measurement itself, without installation, cooldown or warmup
batch size: how many devices share one cooldown
batch size of the system you are comparing against
Time to first result
LTR
5.8 h
DR
25.0 h
77.0% time saved
when the first low-temperature data point is on the screen
Total time
LTR
64 h
DR
445 h
85.6% time saved
all runs, from first installation to last warmup
Cost per device
LTR
€34
DR
€221
84.8% cost saved
personnel and electricity, divided by the number of samples
Total cost
LTR
€337
DR
€2,210
84.8% cost saved
personnel and electricity across all runs
The model behind these numbers is the one described above: personnel at €50 per hour, electricity at €2 per operating hour, and the phase durations from Table 1. The dilution refrigerator is counted as powered during cooldown and measurement only.
Deploying the L-Type Rapid to eliminate characterization bottlenecks
Overall, our comparison shows that fast-feedback cryostats help reduce both total characterization time and cost in a variety of batch sizes and measurement durations. With this overall reduction in time and labor requirements, users can eliminate downtime in their characterization process and achieve additional cost savings. Over continued use, these savings can accumulate as more tests are implemented and if additional cryostats are deployed.
With its automatic sample loading and continuous cooling features, the L-Type Rapid surpasses traditional dilution refrigerators as both a speed and cost-reducing asset for quantum labs in a variety of low-temperature characterization scenarios.
References
[1] Quantum Economic Development Consortium et al. (2021). Cryogenic advances a must for quantum technology applications. Quantum Economic Development Consortium.
[2] Boiko, B. et al. (2023). Low-noise amplifier cryogenic testbed validation in a TaaS (Testing-as-a-Service) framework. arXiv.
[3] Megrant, A. et al. (2025). Scaling up superconducting quantum computers. Nature Electronics, 8(7), 549–551.
Take this information with you.
Download PDF
Contact
Get in touch with our team
From first experiments to scaled-up quantum systems, our team can help you find the right cooling system for your work.