
Application note
Cryogenic environment optimization for superconducting transmon qubit characterization
We use a kiutra L-Type Rapid fast characterization cryostat to investigate the influence of the electromagnetic sample environment on the qubit relaxation time T1. We use a ConScience superconducting qubit (QiB0), measured over several days in multiple cooldowns at 50 mK, to show how noise sources can be mitigated by the use of appropriate shielding. The study demonstrates how the L-Type Rapid cryostat can be efficiently used to improve system architecture and design of superconducting qubits. In addition, we suggest some best practices for shielding superconducting qubits.
Keywords: Superconducting qubits; Fast-fabrication feedback; Quantum computing; Superconducting strategies for quantum information; Quantum system optimization.
Products: kiutra L-Type Rapid; ConScience QiB0.
Introduction
In the race toward building a fault-tolerant quantum computer, superconducting qubits have emerged as one of the most promising technologies. One key factor is their compatibility with industry-standard large-scale production facilities, employing semiconductor nano-fabrication processes at wafer scale1. While manufacturing has improved in recent years, exploring alternative circuit designs and materials has become essential to developing a robust quantum computing architecture, suitable for large scale production. To achieve this, metrology plays a pivotal role in evaluating the reproducibility of qubit parameters, while benchmarking establishes realistic performance targets based on well-defined industry standards.
A robust test of qubit performance typically constitutes complex and time-consuming measurements at millikelvin temperatures right after fabrication, limiting testing iterations and slowing down innovation. This application note demonstrates how the kiutra L-Type Rapid (LTR) efficiently shortens testing cycles and provides reliable insights into qubit and fabrication quality within only a few hours. To illustrate this, we characterize a ConScience Qubit in a Box (QiB0) and demonstrate how the qubit electromagnetic environment can be optimized in a fast and effective way. Our results highlight the kiutra LTR as an ideal system for quality control and test of superconducting qubits at millikelvin temperatures.
Measurement plan
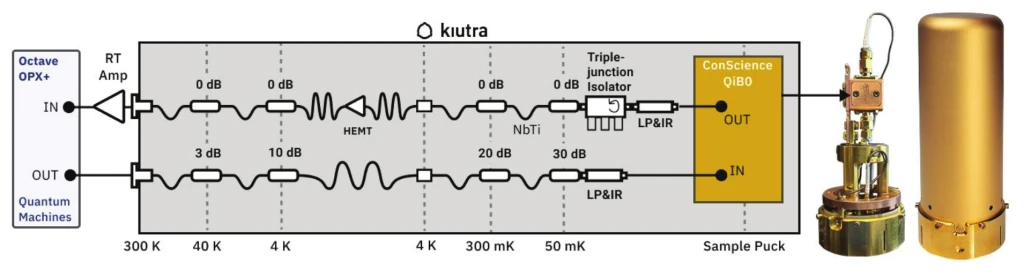
An accepted benchmark for superconducting qubits is its decoherence, which defines the temporal stability of energy relaxation, dephasing and qubit transition frequency2. Here, we discuss relaxation time (T1) as a lifetime measure for a transmon qubit in the following environmental conditions: inside the cryostat with no shield around the qubit case; with gold-plated brass shield enclosing the case; with gold-plated brass shield plus IR absorption layer, instead. We demonstrate this in a kiutra L-Type Rapid cryostat based on Adiabatic Demagnetization Refrigeration (ADR). Our results showcase that the effect of near-environment conditions dominate the qubit coherence times and that stray magnetic field contributions from the magnetic cooling are efficiently suppressed by an integrated multi-layer magnetic shielding and have no effect on the T1 relaxation times.
In this note, we use a ConScience QiB0, which consists of 4 fixed frequency transmon single qubits (3-5 GHz) and 2 hanging resonators (6-7 GHz). The qubits were fabricated ensuring a lifetime (T1) above 60 µs and the quality factor of the resonators is approximately 1M. It is bonded and packaged inside an oxygen-free gold-plated copper case and has two female SMA connectors, for input and output readout. Figure 1 shows the sample mounted on an adapter plate to fix it onto a kiutra Puck 55 with RF connections that match those of the QiB0.
At the top of the cryostat plate, SMA feedthroughs give access to the RF lines. For our measurement, we connect the input and output lines of the LTR to a Quantum Machines Octave and OPX+ and post-process the data using a Python library developed at kiutra for this application. Figure 1 depicts all basic components of our setup.
Experiment results
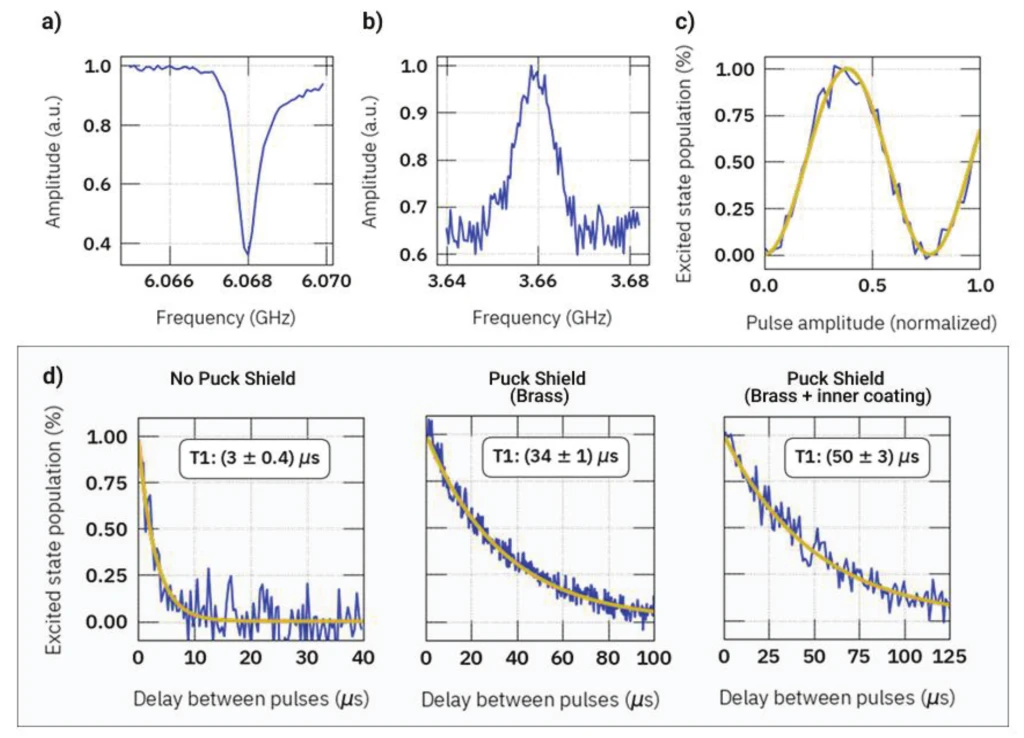
To characterize a transmon qubit, we load the sample into the L-Type Rapid and cool it down to 50 mK. Once the sample has thermalized, we perform a spectroscopy measurement to identify the readout resonator frequency. Figure 2a shows a normalized frequency sweep of the readout resonator with a pronounced resonance at 6.068 GHz. We continue with a two-tone spectroscopy to determine the qubit’s drive frequency from the ground to the first excited state. A typical result is shown in Figure 2b, where a broad peak around the qubit frequency is visible. Next, we perform Rabi oscillation measurements to calibrate the excitation pulse required for full qubit excitation. Figure 2c shows the excited state population as a function of the pulse amplitude, exhibiting typical Rabi oscillations. Finally, we measure the qubit’s relaxation time T1 by applying a calibrated π-pulse to excite the qubit and reading out its state after a variable time delay. Figure 2d shows the measured excited state population as a function of the applied pulse delay for different shielding scenarios. We extract T1 by fitting the population of the excited state as a function of the readout delay to a single-exponential decay (solid line in Figure 2d).
Figure 2d shows measurements of T1 of the same qubit in three different loadings and different shielding scenarios. To provide reliable statistics on our measurements, we collected T1 measurements every 15 minutes for 12 to 24 hours and repeated the measurements for a second time to validate our results. The L-Type rapid can stabilize a temperature of 50 mK for around 3-6 hours. To achieve continuous measurements for up to 24 hours or more, we enabled the automatic regeneration, which automatically recharges the cooling units and stabilizes the temperature at its original setpoint. Using a simple software command, data collection can be paused, while the cryostat recharges (approx. 80 mins) and automatically started again once the initial setpoint is reached. This allows us to collect data continuously at 50 mK and our results suggest that the regeneration cycle has no influence on the qubit properties and T1 times.
| QiB0 on Puck | Run 1 T1 (µs) | Run 2 T1 (µs) |
|---|---|---|
| No shield | 3 | 3 |
| Brass shield | 37 | 37 |
| Brass shield with inner coating | 43 | 50 |
Table 1: T1 average at 50 mK. Run 1 (12 hours) and Run 2 (24 hours) are different cooldowns, involving unloading and loading the qubit.
Table 1 shows the results of our long-term measurements. We find a T1 average of 3 µs for the Puck without shield, increasing to 37 µs for a gold-coated brass shield and finally reaching up to 50 µs for a shield with additional IR coating. We attribute the increase in T1 times to the additional screening of electromagnetic interference by the metallic brass shield, acting as a Faraday cage, and an additional protection against thermal (infrared) radiation by the inner coating of the shield. As our results match closely with the qubits specified fabrication parameters, we believe that static magnetic fields are not a limiting factor, and that the L-Type Rapid can be used for a fast and efficient superconducting qubit characterization.
Conclusions
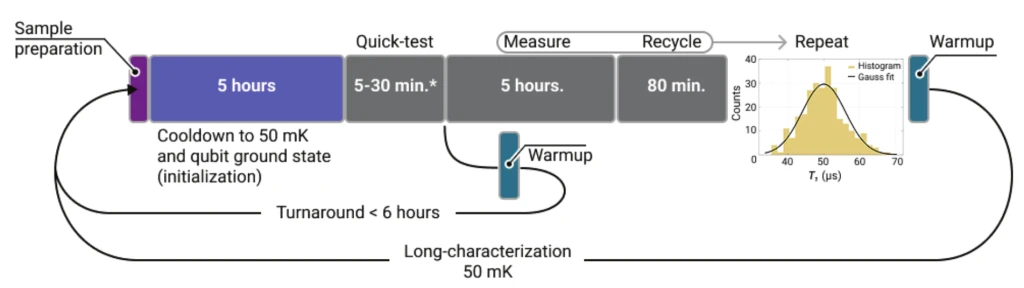
We demonstrate a robust characterization of a ConScience transmon qubit using a kiutra L-Type Rapid cryostat. Our study examines three different shielding configurations in an efficient and reproducible manner. We show that T1 is highly sensitive to the qubit’s electromagnetic environment and conclude that using a metallic shield acting as a Faraday cage, coated with a charcoal-based material for infrared absorption, constitutes a suitable shielding environment for qubit measurements. This is combined with an internal magnetic shielding consisting of multiple layers of Cryoperm and superconductors to block contributions from the earth magnetic field as well as from the magnetic cooling units of the L-Type Rapid. In addition to its fast turnaround, the L-Type Rapid proves to be an efficient solution for conducting long-term studies of superconducting qubit properties, even at temperatures as low as 50 mK. Figure 3 shows our typical measurement cycles, where the sample is cooled down to base temperature in typically less than 5 hours. Using state of the art electronics, first qubit results can be expected only a few minutes after the cooldown, making turnaround times of less than 6 hours possible. The speed advantage and level of automation of the L-Type Rapid can support researchers and engineers to significantly accelerate the development of superconducting qubit platforms and facilitate the industrial adoption of qubit metrology and benchmarking as a quality test in large-scale production.
Acknowledgements
We would like to thank ConScience for providing us with the QiB0 qubit for the demonstration measurements performed in this application note.
- Van Damme, J., Massar, S., Acharya, R., Ivanov, T., Perez Lozano, D., Canvel, Y., ... & De Greve, K. (2024). Advanced CMOS manufacturing of superconducting qubits on 300mm wafers. Nature, 634(8032), 74-79.
- Burnett, J. J., Bengtsson, A., Scigliuzzo, M., Niepce, D., Kudra, M., Delsing, P., & Bylander, J. (2019). Decoherence benchmarking of superconducting qubits. npj Quantum Information, 5 (1), 54.
Take this information with you.
Download PDF
Contact
Get in touch with our team
From first experiments to scaled-up quantum systems, our team can help you find the right cooling system for your work.