


Application note
High throughput characterization of superconducting microwave resonators at millikelvin temperatures
We present the characterization of microwave superconducting resonators with a turnaround time of less than five hours. This is made possible by the unmatched speed of the kiutra L-Type Rapid and the real-time sweeping capabilities of the SHFQA+. By investigating the internal quality factor as a function of input power and temperature, we demonstrate fast and reliable measurements of superconducting resonators at radio frequencies and millikelvin temperatures.
Products: kiutra L-Type Rapid, Zurich Instruments SHFQA+.
Keywords: Microwave spectroscopy; RF characterization; non-linearities in microwave circuits; superconducting qubits; quantum processing unit production.
Introduction
Microwave resonators are an essential building block of superconducting quantum processor units, facilitating qubit readout. Their characterization is an established method to gauge materials for the fabrication of superconducting qubits and to improve fabrication methods by tracing noise sources and decoherence mechanisms that affect the superconducting qubits, such as two-level-systems (TLS)1. The performance of a superconducting microwave resonator is hereby assessed by measuring its internal quality factor (Qint), a measure of how efficiently it stores energy.
Rapid characterization of resonators close to the qubit operating temperature is imperative for fast development cycles in fabrication, and it should serve as a routine step to produce high-quality qubits and superconducting circuits in general, enhancing the efficiency and reliability of quantum computing chips manufacturing. The kiutra L-Type Rapid (LTR) Cryostat in combination with the Zurich Instruments Quantum Analyzer (SHFQA+) addresses this demand by realizing fast turnaround times of less than 5 hours for the characterization of superconducting microwave resonator at millikelvin temperatures. If required, the fast and easy temperature control of the LTR allows us to add a temperature dependent measurement for an in-depth investigation of the resonator properties.
Measurement Plan
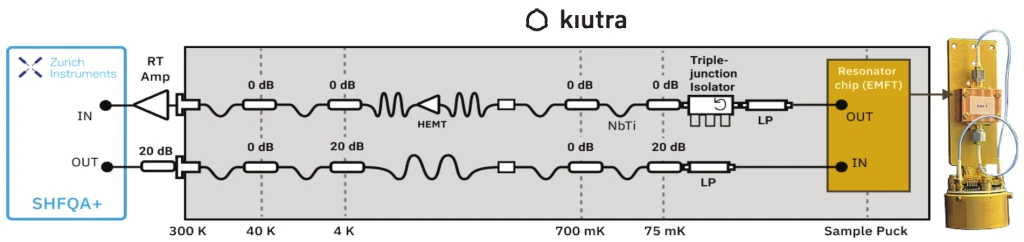
In this application note we characterize a sample of nine superconducting aluminum microwave resonators coupled to a common transmission line. The sample is packaged inside a copper box with two SMA connection ports. We mount the sample on a custom-made adapter plate and mount it onto a kiutra Puck 36 as shown in Figure 1. Input and output port of the sample box are connected to the RF lines on the puck, which mate with the internal RF lines upon loading into the cryostat.
The sample is loaded into an L-Type Rapid cryostat equipped with a commonly used microwave I/O chain and a multi-layer magnetic shielding. The two RF lines that connect the sample and the relevant RF components are outlined in Figure 1. The lines are calibrated at kiutra with a precision of less than 3 dB before starting the experiments, which allows us to later determine the number of photons based on the input power2. To measure, we connect input and output lines from the SMA feedthroughs at the cryostat top plate to the two corresponding SHFQA+ ports.
The quality of the resonator is then determined in three different steps. First, the resonances are detected to identify the resonators; second, the power dependence of the internal quality factor is recorded for each resonator; third, as an optional step, the change of the internal quality factor is determined as a function of temperature.
Experimental Results
Resonance frequency detection
After cooling the sample down to 75 mK, the first step is to find the resonators’ resonance frequencies. To do this, we sweep the input signal frequency and measure its transmission at a fixed temperature. At the resonance frequency the resonator exhibits maximum response and can be identified by a sharp dip in the transmission amplitude.
With 1 GHz bandwidth, the Frequency Sweeper Module of the SHFQA+ enables real-time spectroscopy close to the physical limit of the measurement technique. A frequency sweep can be directly programmed on the instrument, where the onboard data averaging and logging functionality significantly reduces the communication overhead during a measurement.
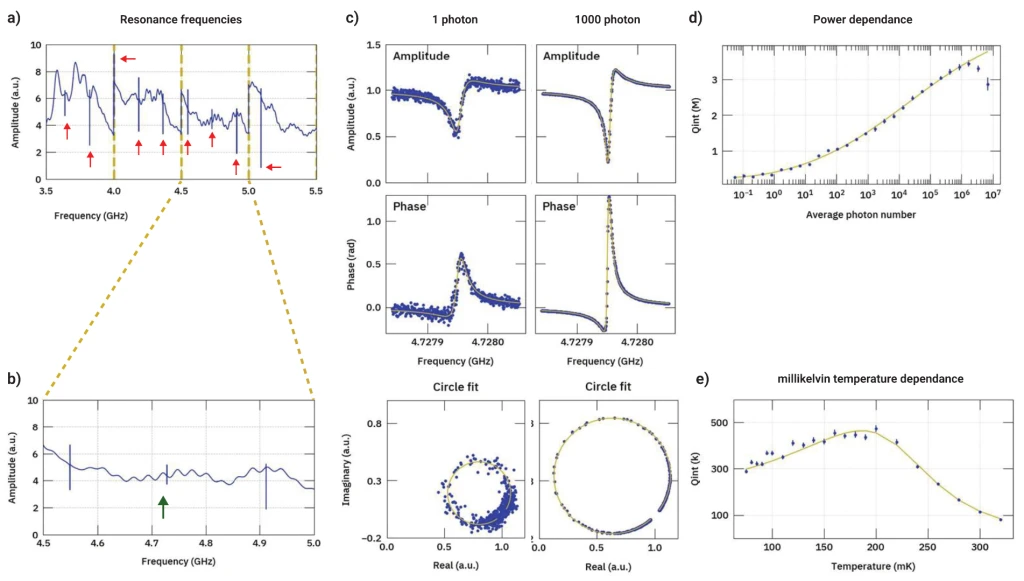
The resonators of the sample under investigation exhibit resonance frequencies distributed between 3.5 GHz and 5.5 GHz. The transmitted signal amplitude as function of the input frequency is shown in Figures 2a and 2b. The resonance frequencies of all nine resonators are indicated with arrows. We scan this range in multiple segments. In each segment, we sweep the input frequency over 500 MHz with a step size of 50 kHz. Here, we set the input power to a level equivalent to ~1000 photons. Figure 2b shows one single scan from 4.5 to 5.0 GHz. We continue with a finer spectroscopy around each resonance. Figure 2c shows typical data of the measured transmitted amplitude and phase for input powers equivalent to ~1 and ~1000 photons. We extract Qint from this data using a circle fit technique3.
Power dependence
To further characterize the resonator, we vary the input power and measure the corresponding change of Qint (Figure 2d). The large power dynamic range of the SHFQA+ allows us to measure all resonators from single photon to saturation (>106 photons) without using additional amplification or attenuation on the input line. Thanks to the real-time frequency sweeping and result logging, the measurement time per resonator and input power is on the order of tens of seconds (<10 seconds for higher powers, 48 seconds for the lowest power). We observe that the input power influences the resonator’s Qint, as is expected because of power induced nonlinear effects and saturation of quasiparticles4. We fit our measurement results with a kiutra Python library for post-processing superconducting microwave resonator data, which uses a model based on Ref.5. The fit matches the data at lower and middle powers very well, which allows us to assess the functionality of these devices, as only low power excitations are used in typical quantum computing applications. At high power, Qint is influenced by material-specific loss mechanisms not included in the model.
Millikelvin temperature dependence
Finally, we measure Qint for different temperatures ranging from 75 mK to 350 mK in steps of 10 mK (Figure 2d). The input power is kept constant at the single photon limit. Each temperature step needs only a few minutes to stabilize due to the efficient temperature control of the LTR. Each frequency sweep takes 48 seconds (501 frequency points, 6 averages with 0.016 s integration time per point) at single photon input power level. As shown in Figure 2e, we observe an initial rise of Qint for increasing temperature, followed by a decrease towards higher temperatures. This behavior is expected, and the data can be fitted using a kiutra Python library that makes use of a model based on Ref.6.
Conclusions
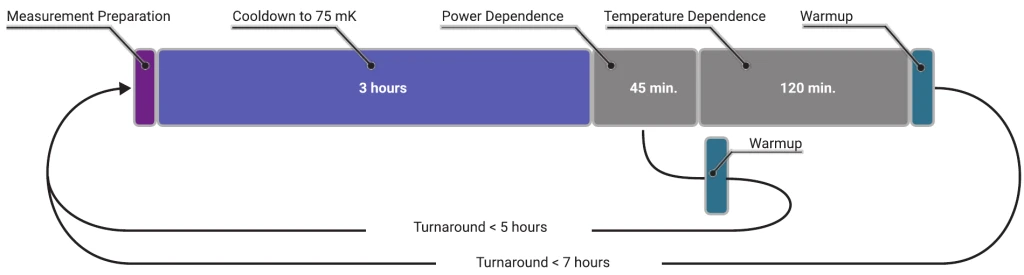
We integrate technologies from kiutra and Zurich Instruments to achieve a comprehensive characterization cycle of superconducting microwave resonators in under five hours, as summarized in Figure 3. Our approach significantly reduces the time required for millikelvin-temperature characterization compared to traditional dilution refrigerators and vector network analyzers.
Thanks to the fast, user-friendly operation of the kiutra L-Type Rapid and the Zurich Instruments SHFQA+ Quantum Analyzer - capable of frequency sweeps at the speed limit - measurements are both efficient and straightforward. Automating key processes such as sample loading, cooldown, and temperature control minimizes manual effort, ensuring consistent, repeatable results. The L-Type Rapid’s puck-based sample loading mechanism further simplifies consecutive device loadings, making it ideal for fabrication environments and shared research facilities.
As quantum technologies advance, rapid characterization of superconducting microwave resonators will become increasingly valuable. By streamlining the full characterization chain, as demonstrated here, researchers can accelerate the fabrication of superconducting radiofrequency devices, reducing both time and effort.
Acknowledgements
We would like to thank the Fraunhofer Institute for Electronic Microsystems and Solid-State Technologies (EMFT) for providing us with the superconducting microwave resonators used for the measurements presented here.
The development of the measurement described in this work was funded within the CRYOFAST project through European innovation funding. The project supports fast and cost-effective cryogenic characterization of materials and devices.
Funded by the European Union. Views and opinions expressed are however those of the author(s) only and do not necessarily reflect those of the European Union or the European Innovation Council. Neither the European Union nor the granting authority can be held responsible for them.
References
- Oliver, W. D., & Welander, P. B. (2013).
- Blais, A., Huang, R. S., Wallraff, A., Girvin, S. M., & Schoelkopf, R. J. (2004).
- Probst, S., Song, F. B., Bushev, P. A., Ustinov, A. V., & Weides, M. (2015).
- McRae, C. R. H., Wang, H., Gao, J., Vissers, M. R., Brecht, T., Dunsworth, A., … & Mutus, J. (2020).
- Lozano, D. P., Mongillo, M., Piao, X., Couet, S., Wan, D., Canvel, Y., … & De Greve, K. (2022).
- Zoepfl, D., Muppalla, P. R., Schneider, C. M. F., Kasemann, S., Partel, S., & Kirchmair, G. (2017).
About Zurich Instruments
Zurich Instruments makes cutting-edge instrumentation for scientists and technologists in advanced laboratories. We have revolutionized instrumentation with fully digital lock-in amplifiers and the first commercial quantum computing control system. By combining excellent hardware, signal generation, and signal analysis in the frequency-domain and time-domain within single products, we help to reduce the complexity of laboratory setups and support innovative measurements in the DC to Gigahertz range.
Take this information with you.
Download PDF
Contact
Get in touch with our team
From first experiments to scaled-up quantum systems, our team can help you find the right cooling system for your work.