CRYOGENIC SERVICES / SUPERCONDUCTING RESONATOR
Resonator measurement as a service
CRYOGENIC SERVICES/ SUPERCONDUCTING RESONATOR
Resonator measurement as a service
Customer voices
Gemma Rius
Leading Research Scientist at the Institute of Microelectronics of Barcelona (IMB-CNM-CSIC) on Superconductor and Hybrid Chips for Quantum
Cryogenics as a Service in the L-Type Rapid enabled us to characterize remotely a batch of our superconducting resonators in a single round overall with minimal preparations and getting reliable data. Aimed at studying and comparing temperature dependence in arrays of superconducting resonators in a few different samples, we are certainly using the cryogenics service again for next generations of the superconducting devices and circuits we fabricate, while planning to apply also the other available measurement modes for our developments on thin films and hybrid devices.
Superconducting resonators play a key role in quantum processors, enabling non-destructive qubit readout.
Characterizing these resonators is essential for identifying and minimizing disruptive effects such as noise and decoherence caused by two-level systems (TLS).
Our measurement setup uses a vector network analyzer to determine the resonance frequency and power and/or temperature dependence of the quality factors, providing insight into loss mechanisms and material properties.
Click image to enlarge.
Superconducting microwave resonator characterization measurements. This measurement was performed in collaboration with Zurich Instruments and Fraunhofer Institute for Electronic Microsystems and Solid-State Technologies (EMFT).
How does a standard measurement work?
To analyze how RF signals behave in a Device Under Test (DUT), we use a Keysight P5024B Network Vector Analyzer (VNA). The VNA characterizes the electrical properties of RF and microwave components by measuring how they reflect and transmit signals.
The VNA has an internal RF source generating signals across a frequency range from kHz to GHz. This signal is split internally: one part goes to a reference receiver, providing a known amplitude and phase reference, while the other is sent to the DUT. The DUT reflects and transmits portions of the signal depending on its characteristics.
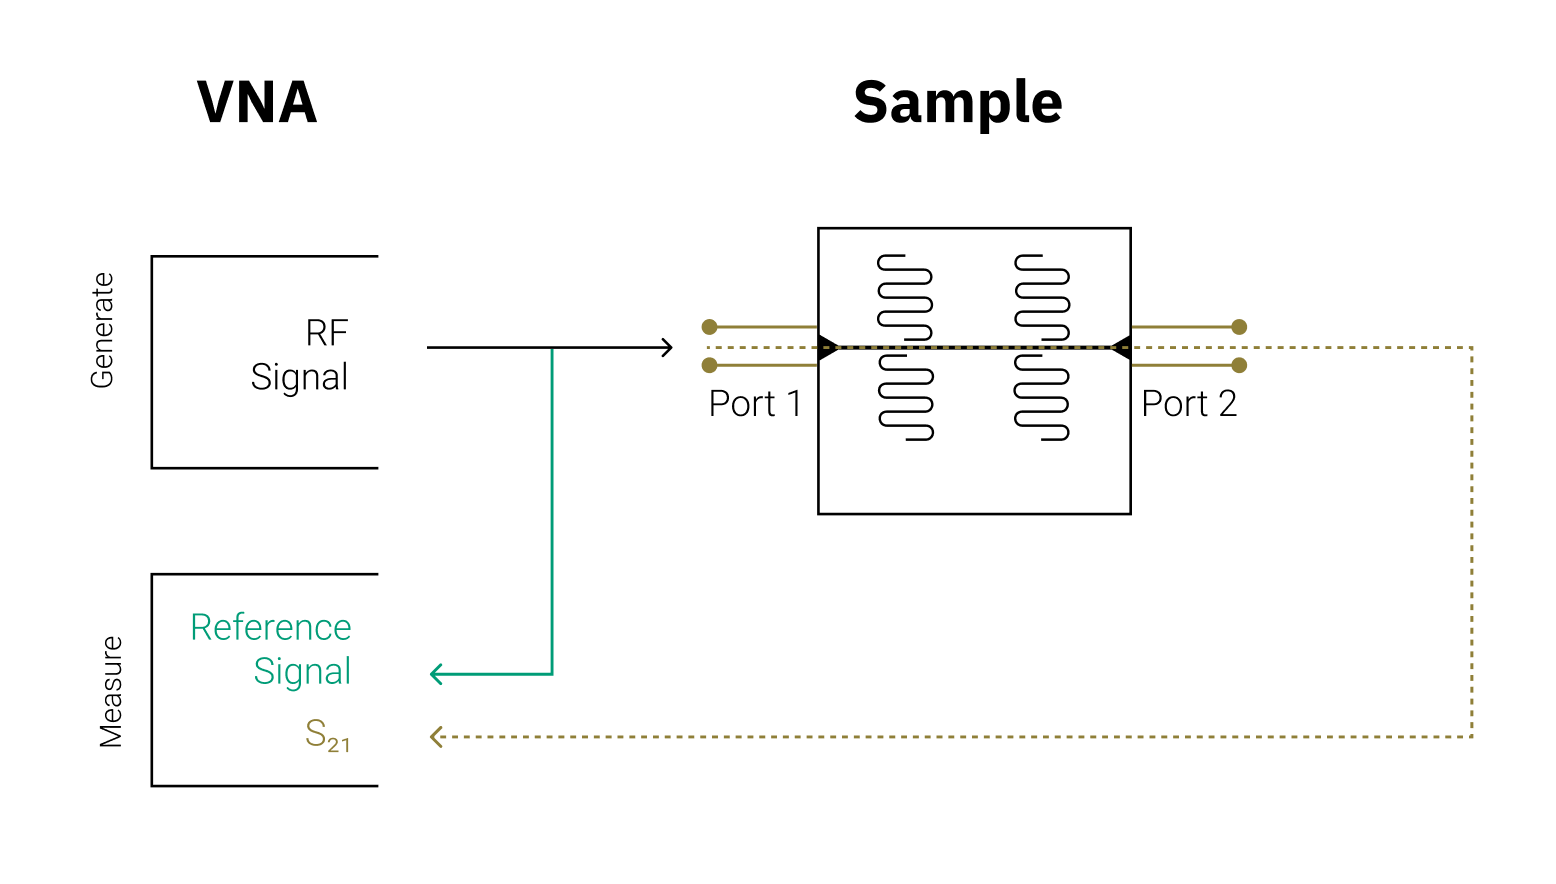
By comparing the DUT response to the reference, the VNA calculates scattering parameters (S-parameters). In a two-port setup, the key parameters are:
- S11: Reflection at port 1 (input)
- S22: Reflection at port 2 (output)
- S21: Forward transmission from port 1 to port 2 (gain or loss)
- S12: Reverse transmission from port 2 to port 1
For a standard resonator measurement, it is sufficient to focus only on S21.
The full characterization procedure consists of three steps, outlined below. A full characterization is not always required, and customers can choose the type of measurements required for their research.
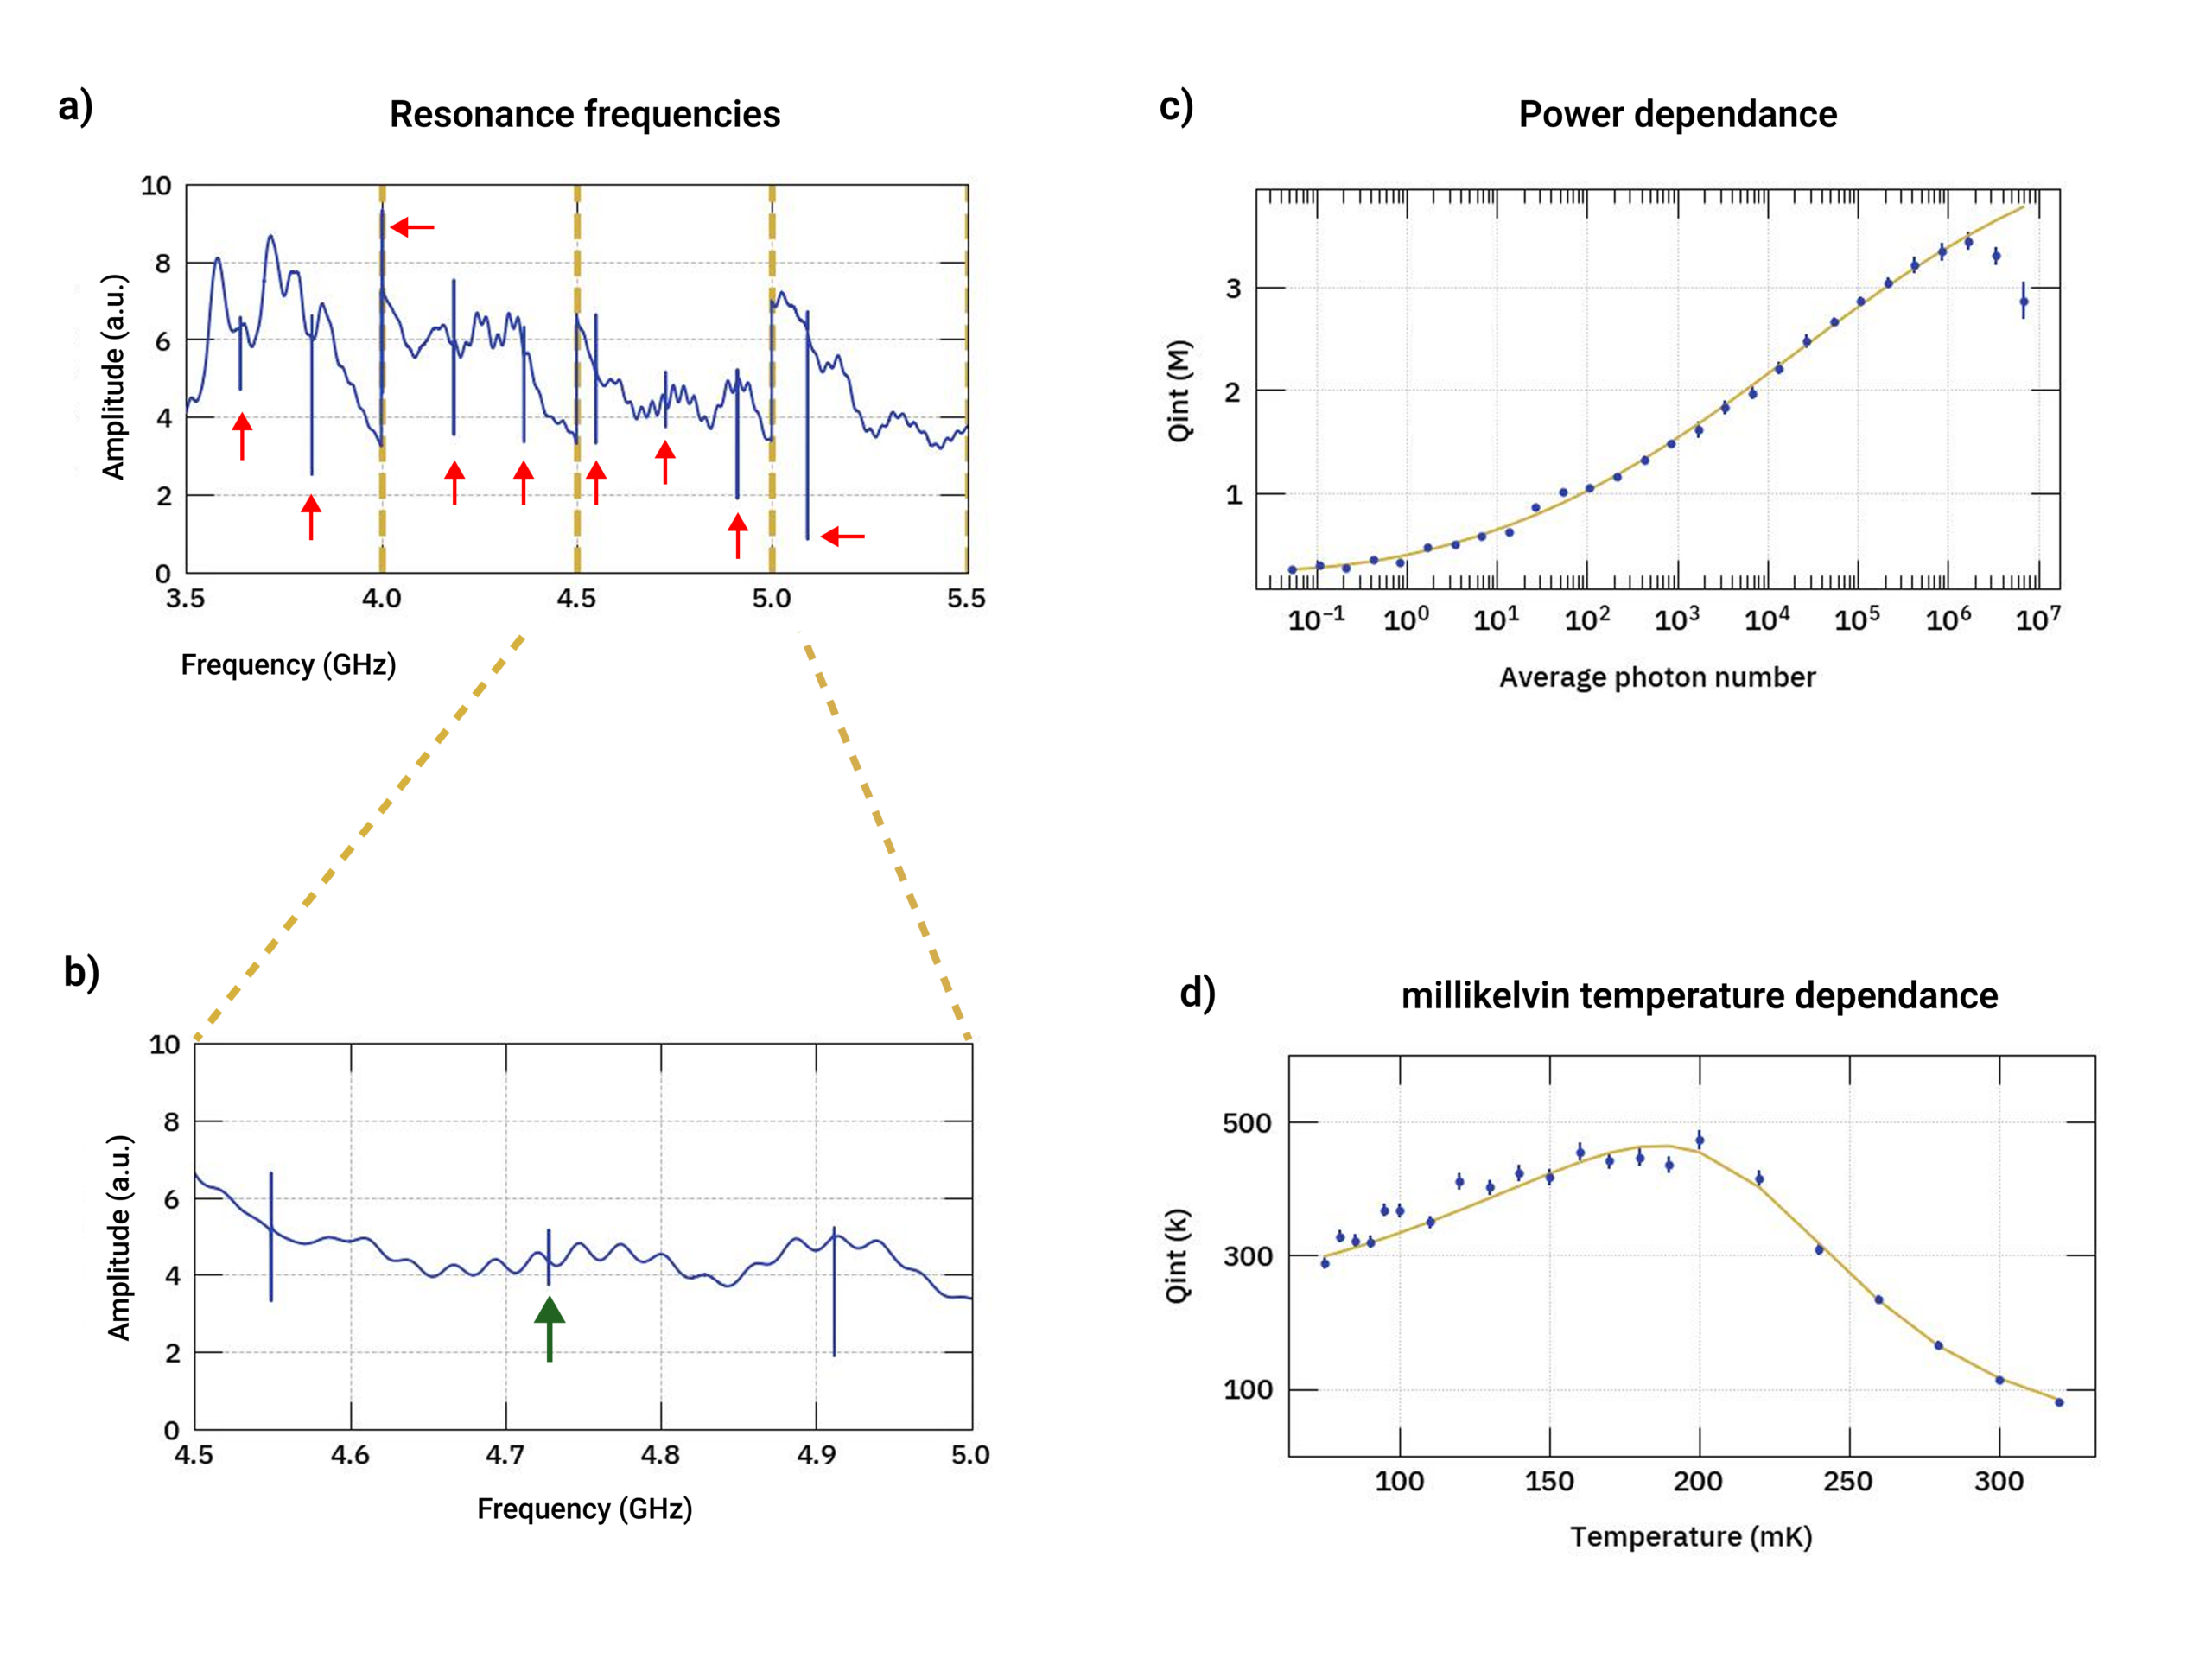
1. Resonance frequency detection
The first step is to identify the resonance frequencies of the DUT. To achieve this, we sweep the RF signal across a frequency range and record its transmission using the VNA. During this scan, both the temperature and the applied RF power remain constant. Resonances appear as frequency-dependent changes in the transmission amplitude and phase.
The transmission of a resonator is a complex quantity, consisting of both amplitude and phase. When plotted in the complex plane (real vs. imaginary part), the data traces a circular path. By fitting this circle, the following parameters can be extracted:
- Qint – the internal quality factor, describing intrinsic losses within the resonator. A low Qint indicates high internal losses.
- Qc – the coupling quality factor, reflecting how strongly the resonator is coupled to the measurement line. A low Qc corresponds to strong coupling.
- Qtotal – the loaded quality factor, which accounts for both internal and coupling losses.
2. Power dependence of Q-factors
In this step, the Q-factors are evaluated as a function of the applied RF input powers while keeping the temperature constant. The measurement range typically begins about 3 dB below the single-photon limit, which refers to the regime where the resonator stores, on average, a single photon. The average energy stored in the resonator is:
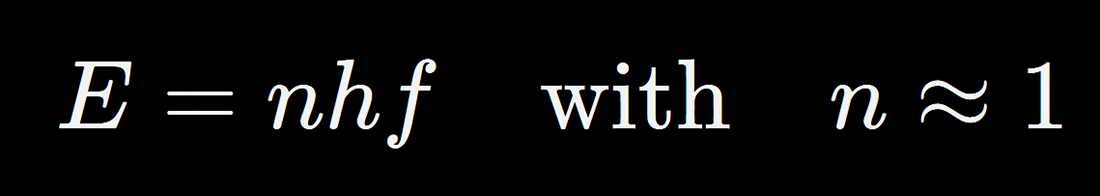
where n is the average photon number, h is Planck’s constant, and f is the resonator frequency.
The corresponding input power required to sustain this energy defines the single-photon power level:
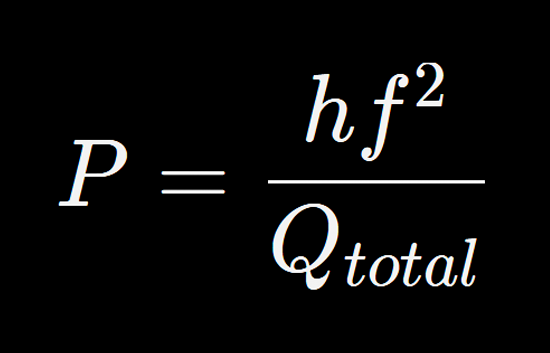
Operating in this limit is essential for probing quantum effects in superconducting resonators, such as coherence properties or interactions with qubits, where even a few excess photons can introduce unwanted nonlinearities, heating, or decoherence.
After identifying the single-photon level, the input power is gradually increased – typically up to 6–10 dB above the point where Qint reaches its maximum, or until the maximum output power of the VNA is reached, whichever comes first.
3. Temperature dependence of Q-factors
In this step, the Q-factors are evaluated at different temperatures while keeping the RF input powers constant. The temperature sweep starts at the lowest available setpoint, and it is increased until the resonator response becomes too weak to resolve.
Click image to enlarge.
Schematic of the measurement setup. The Vector Network Analyzer includes an RF source and receiver, enabling generation of an RF signal and measurement of the transmission (S21) from port 1 to port 2 by comparing it to a reference signal.
Sample carrier and breakout
kiutra offers a copper box with two SMA ports designed for mounting and connecting resonators. It accommodates a 10 × 10 mm sample chip. Alternatively, we can evaluate the compatibility of customer-provided sample holders or support in designing custom holders for specific applications.
Once prepared, the sample box is mounted onto an adapter plate that fits a kiutra Puck. The input and output ports of the sample box are connected to the RF lines on the puck.
When the puck is loaded into an L-Type Rapid cryostat, its RF connectors automatically mate with the cryostat’s internal RF wiring. The VNA is connected to the corresponding input and output RF lines of the cryostat.
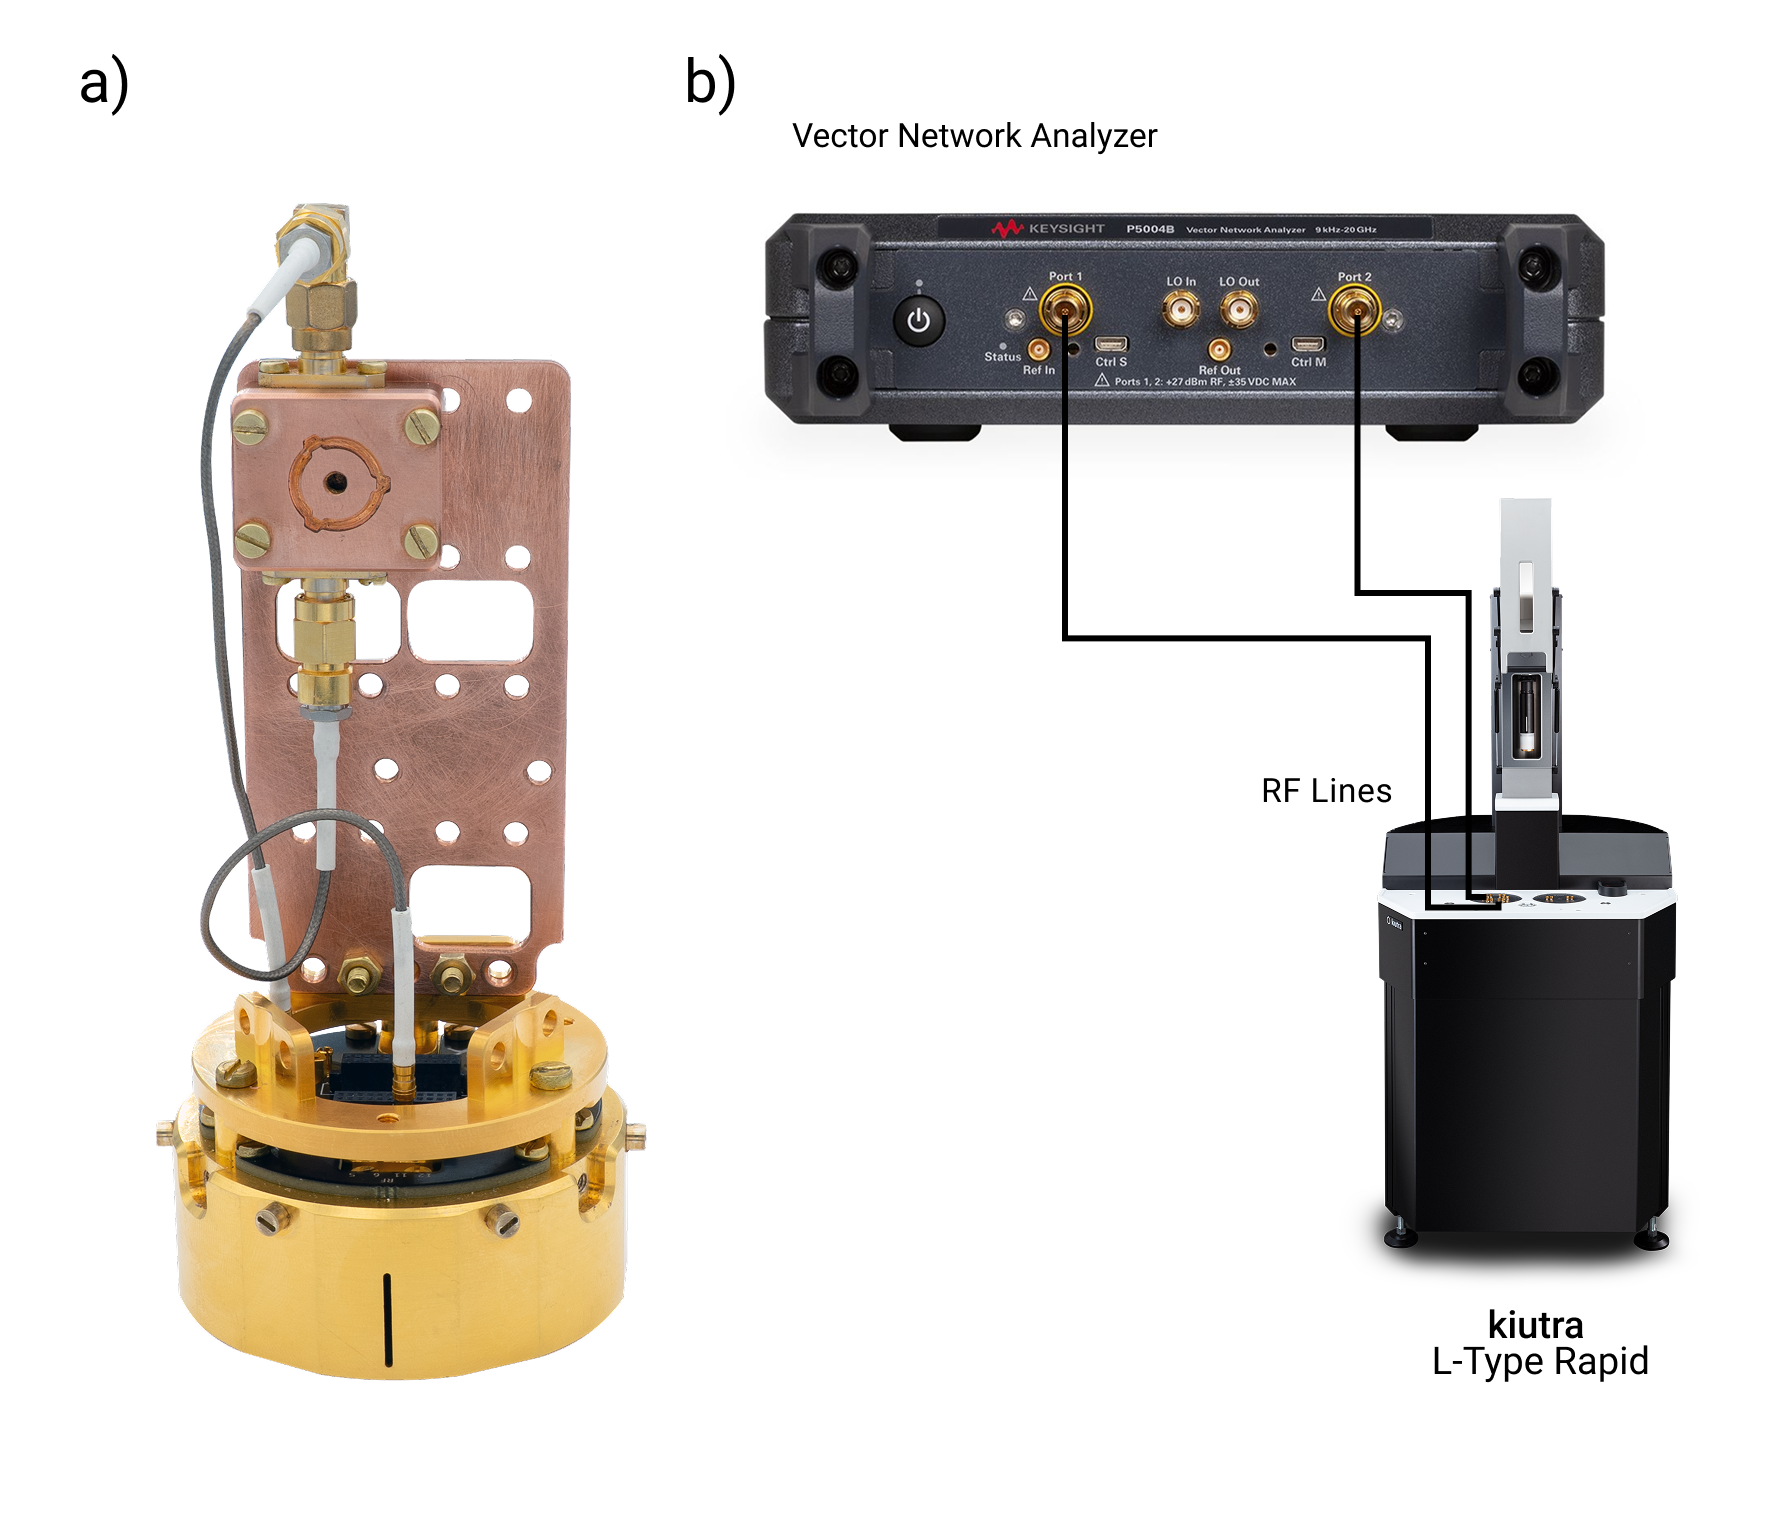
a) A kiutra resonator box with two SMA ports connected to a puck. b) Room temperature measurement setup consisting of a Keysight P5024B Vector Network Analyzer, additional amplifier and/or attenuators and an L-Type Rapid cryostat.
Calibration
Before measuring, the input RF line (from the VNA port, through the entire cryostat wiring to the resonator box input port) is calibrated. This calibration accounts for all components in the signal path, including cables, attenuators, and connectors. Knowing the total attenuation enables accurate calculation of the actual power delivered to the resonator port, which is essential for determining the average photon number during measurements.
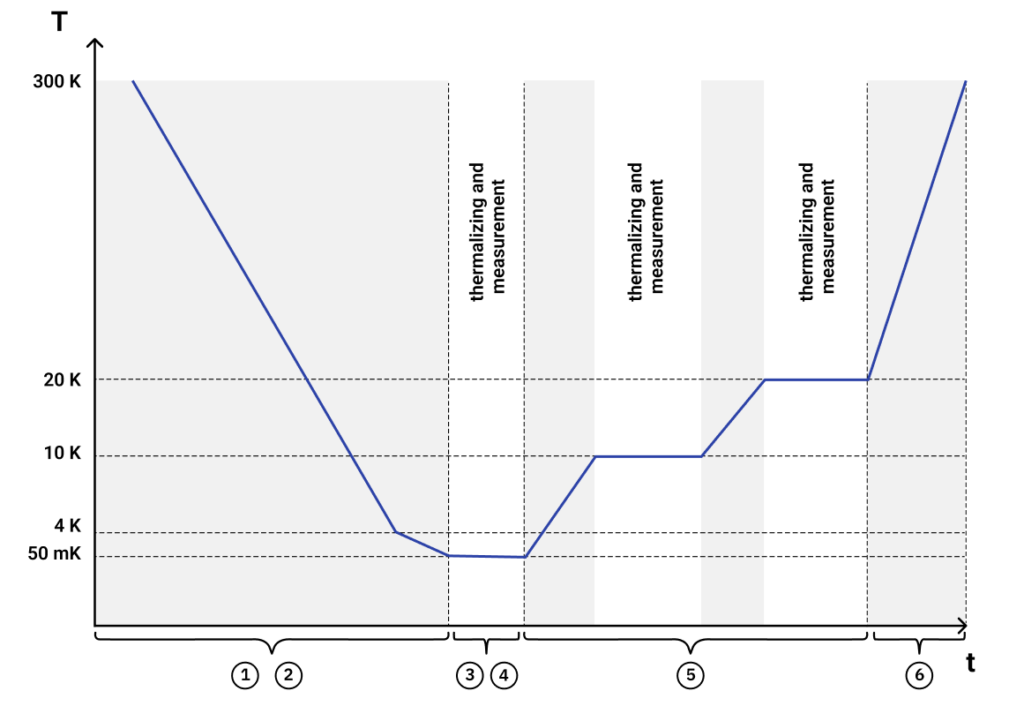
Standard measurement protocol
1. The kiutra puck with the sample box and the mounted resonator is loaded into the cryostat and cooled down to bath temperature.
2. The puck is further cooled down to the target temperature.
3. At the stabilized temperature setpoint, a frequency sweep is performed while recording the transmission using a vector network analyzer.
4. Optional: The frequency sweep is repeated at different RF power steps.
5. Optional: The frequency sweep is repeated at different temperature steps
6. The puck is removed from the cryostat and warmed up to room temperature.
Parameters:
* Value has to be provided by the customer prior to the measurement and must be within the specified range.
The following input line configurations can be chosen:
Can’t find what you need?
We support custom measurement requests for setups outside our standard protocol. Please get in touch for a quote. This will include a one-time setup fee. If you run the same measurement again later, we will reuse the protocol at no extra cost.
Email us at: info@kiutra.com.